In-Depth
Troubleshooting Disk Troubles, or How to Speak SAN-ish
Insights from a Microsoft Premier Field Engineer on how to identify poor disk performance conditions and how to communicate the problem to SAN administrators and vendors.Insights from a Microsoft Premier Field Engineer on how to identify poor disk performance conditions and how to communicate the problem to SAN administrators and vendors.
- By Clint Huffman
- 05/12/2011
Hello world! I am a Microsoft Premier Field Engineer with Microsoft and a Windows Internals certified professional. Each week, I encounter challenging performance issues on enterprise hardware and I want to share some of my cases with readers of MCPmag.com.
For this first piece, I want to call out initial indicators of potential disk performance issues -- in particularly with SANs -- and how to talk to your SAN administrators knowledgably about the condition.
Recently, I was analyzing a production Windows Server 2003 R2 computer running Internet Information Services. The server seemed slow and sluggish to the administrators and many of the users. After ruling out memory conditions, I turned my attention to the disk subsystem and I was very surprised to see very high response times. Normally, Web servers do very little disk I/O and I rarely see any concern here, but this case was different.
Check out Fig. 1, which shows the "Avg. Disk sec/Write" (write response times) counter for F: drive was over 0.6 seconds or 600 milliseconds (ms). While that might sound fast, let's compare it to the access times (the longest time delay or latency for a device to return data) of hard drives that I found on the internet.
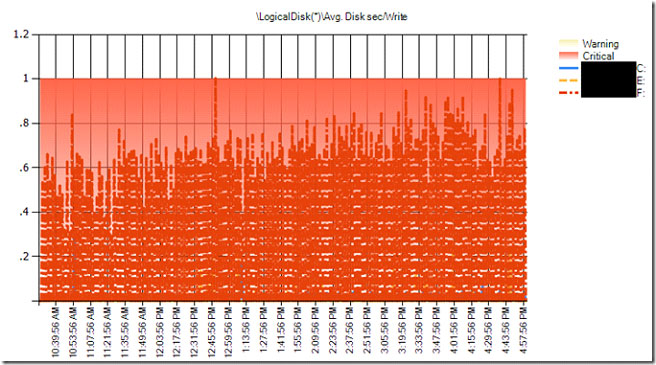 |
Figure 1. The write response times of logical disks; F: drive, in particular, is regularly over 0.6 seconds (600 ms). (Click image to view larger version.) |
The IOPS and access times in Table 1 are very conservative and vary greatly between vendors. I found other charts where the same drives have access times far faster than these at the same RPMs. For example, my 5400 RPM USB disk drive can sustain 150 IOPS and stay under 5 ms average response times. This is because hardware and software cache play a significant role in disk performance. In any case, we can say with some certainty that F: drive is showing I/O response times far slower than a 3.5" floppy disk!
Table 1. Approximate access times and IOPS of various hard drives. (* Note: IOPS does not reflect actual products)
Device |
IOPS* |
Access Time (ms)* |
3.5" floppy disk USB drive |
8 |
120 |
| 5400 RPM hard disk |
59 |
17 |
7200 RPM hard disk |
77 |
13 |
10K RPM hard disk |
125 |
8 |
15K RPM hard disk |
143 |
7 |
solid state drive (SSD) |
5000 |
0.2 |
"Avg. Disk sec/Read" and "Avg. Disk sec/Write" are performance counters that measure the I/O request packet response times for read and write operations respectively. These counters are found on the LogicalDisk and PhyiscalDisk counter objects.
The size of the I/O can dramatically affect the response times, so before I can determine if the response times are okay or not, I need to know the size of the I/Os. So, if F: drive was doing 2 MB I/Os, then that would certainly explain why it appeared slow.
Fig. 2 shows that the F: drive is staying under 64 KB sized I/O, which is relatively small I/O sizes. This means that F: drive should be responding near its manufacturer's access time, which we will assume is about 15 ms. (The average access time between a 5400 RPM hard drive and a 7200 RPM drive, according to Table 1.)
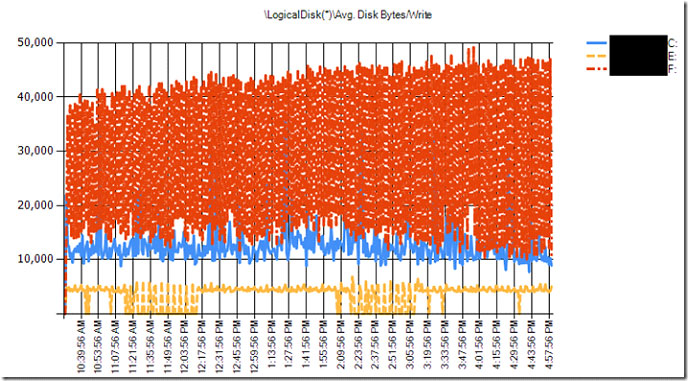 |
Figure 2. F: drive is staying under 64 KB sized I/O (Click image to view larger version.) |
At this point, I could have gone to the SAN administrator and presented my findings. I seriously doubt that he or she can justify I/O response times slower than a floppy disk.
With that said, I can't judge them. The real problem might just be communicating the needs of the server to them.
SAN administrators and SAN vendors know their hardware the best, but they can't predict the disk performance needs of servers. Many server administrators simply ask the SAN administrators for a LUN (logical unit number, a physical disk presented to Windows or Windows Server) of a specific size, so that is what they get -- just capacity.
When the LUN performance is poor, then all of the sudden its the SAN administrators fault. This is why its important to know your application well enough to ask the SAN administrator for more than just a disk of a specific size -- instead, ask them for I/Os per second (IOPS) rates, read/write ratios, and response times. All of these items are configurable by the SAN administrator. You just need to ask for it.
SAN administrators and vendors speak in IOPS. Windows and Windows Server have a performance counter called "Disk Transfers/sec," which is part of the LogicalDisk and PhysicalDisk objects. Disk Transfers/sec is the sum of read and write operations to the disk per second. While that sounds like the definition of IOPS, we have to consider the hardware and RAID type.
Hardware disk controllers and RAID type can change the number of real I/Os that the hardware has to manage. For example, every 1 write operation from Windows would be 2 I/Os on a RAID1 or 4 I/Os on a RAID5. We might see 100 write operations to the disk from an operating system perspective, but the hardware might be managing 400 I/Os.
In any case, knowing the number of read and write operations that your application needs will allow the SAN administrators to allocate enough hardware to meet the need. In this case, F: drive was doing less than 100 IOPS, which a single 5400 RPM or 7200 RPM disk drive should be able to sustain with no problem.
SANs typically have a large amount of battery-backed, high-speed cache in front of them to significantly speed up performance and to reduce disk contention. This cache can usually be adjusted in favor of read or write operations. When I looked at the Disk Reads/sec and Disk Writes/sec performance counters for F: drive, I found that it was doing about 18 percent reads and 82 percent writes.
Disk Reads/sec and Disk Writes/sec are performance counters that measure the number of I/O request packets for read and write operations respectively. These counters are found on the LogicalDisk and PhyiscalDisk counter objects.
Traditionally, disk queue related performance counters such as "Avg. Disk Queue Length", "% Idle Time", and "% Disk Time" have been staples in the IT professionals tool belt. They have great value when analyzing single spindle disks, but are less effective when more spindles are added to a LUN or when spindles are shared between LUNs. For example, if Avg. Disk Queue Length is 2 and there are 10 spindles behind the LUN, then the LUN should have no problems with handling the load. This would be like having 10 checkout lines with only two people in line. Likewise, % Idle Time and % Disk Time are simply measures of how often the disk queue is completely empty or not empty respectively.
Finally, I used Process Monitor (Procmon) from SysInternals.com to capture disk I/O when the system was under load during business hours. The purpose of the trace was to see if all of the disk I/O is necessary. There has been plenty of times where I found backups running by accident during business hours or anti-virus software drivers inducing unnecessary delays. In this case, the trace showed that Microsoft Index Server was the process consuming most of the disk I/O. It was monitoring the file system for new files and modifications, and then indexing them. The frequent file updates caused Index Server to become busy. The Web server users rely on this service for their day to day business, so this I/O was needed.
Note: On Windows 7 and Windows Server 2008 R2, Resource Monitor is a built-in tool that can show live process and file I/O response times.
In conclusion, F: drive on the Web server is clearly a bottleneck on this Web server and Microsoft Index Server was the highest consuming disk I/O process on F: drive. The load generated by Index Server could be easily sustained by a single 5400 RPM disk drive and stay under 5 ms on average response times, but in this case the F: drive's response times increased because the minor amount of load overwhelmed it.
We know that F: drive was on a SAN, but we don't know what is causing it to slow down so much. It could be the Host Bus Adapter (HBA), the SAN fabric (the fiber optic network between the HBA and the SAN), or the SAN itself. This is why it is important to communicate facts like this to SAN administrators and vendor, so they can help you investigate these issues.
Which disk counters do you find helpful? Send us your feedback.
I'd like to do a quick "shout out" to my Microsoft PFE friends, Robert Smith and Jeff Stokes for the great disk performance help over the years. You guys are great!