Money Matters
The 2002 Salary Survey from Microsoft Certified Professional Magazine
 The state of the business world continues to be in turmoil, hiring has slowed and compensation is down. In this year's salary survey for Microsoft Certified Professionals, we examine the outlook for IT experts in this difficult economy.
This marks the seventh year that Microsoft Certified Professional Magazine has examined how certified professionals do their jobs, as well as how they're compensated. This also marks the second year that salaries have taken a fall. As you dig into this year's numbers, you'll, no doubt, be concerned with how big the fall really is and wonder what the future holds: How much should you be earning? How much should you expect to earn? Does your certification make a difference? Should you simply be grateful you have a job? What should you do to strengthen your employability?
To get a clear picture of these concepts, we compiled the results of a lengthy questionnaire, which included responses from nearly 6,000 respondents in all age ranges, job titles and geographical locations in U.S. and across varying levels of experience. What we found, while on the surface appearing disappointing, is also optimistic.
How Bad Is It?
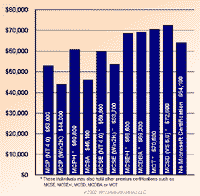
This has been a difficult year for working Americans, and—despite the belief that IT professionals couldn't be touched—this year's numbers show that these tough times are being felt by everyone. Salaries across all certifications have sunk. How bad is it? Well, if you're an MCSE on Windows 2000, the average salary is $53,700, down about 20 percent from 2001's average salary of $67,100. (See Chart 1 for a breakdown of average base salaries across all Microsoft certifications.)
| 2002 Average Base Salary by Certification |
 |
| Click the chart for a larger view. |
| Chart 1. We asked all respondents to report their estimated base income before taxes for 2002. Excluded are all non-direct compensation (see Chart 2 for that information), salaries less than $27,500 and more than $150,000 and the incomes of the self-employed. |
Surprisingly, Windows NT 4.0 MCSEs took a smaller compensation cut—falling to $59,800 from last year's $62,700.
We delved into the salary data to figure out why, a year later, NT 4.0 MCSEs ended up ahead of Win2K MCSEs in compensation. Shouldn't it be the opposite?
While there's no great difference in the number of years NT 4.0 and Win2K MCSEs have been in networking, (seven years for NT, 6.3 years for Win2K), NT 4.0 MCSEs have been Microsoft-certified longer than their Win2K counterparts—three years and 1.5 years, respectively. Also, 69 percent of Win2K MCSEs have held their title for only about six months, as opposed to the 47 percent of NT 4.0 MCSEs, who have held their title for at least two years.
But this doesn't explain the discrepancy by any means. We speculate that, with Microsoft's reversal on the MCSE decertification and .NET Server on the horizon, the hype surrounding the Win2K upgrade has died down and NT 4.0 MCSEs are finding that they don't need to upgrade right away. Seventy-four percent of NT 4.0 MCSEs report that their organizations have deployed Win2K and, therefore, they've had to learn the technology. They appear simply to be holding tight and staying out of the recertification arena.
In addition, only 57 percent of Win2K MCSEs responded that NT 4.0 is a primary area of expertise for them. This could mean companies have placed greater value on those experts with experience in both platforms, as cross-platform expertise is important in migration and upgrade projects. Simply put, your NT 4.0 experience is, once again, paying off.
What can you do until the market balances out? Our research shows that, once again, experience is key. Keep your skills current; be aggressive in continuing your education; and network, network, network. (Don't forget that soft skills can play a major role in getting a job and keeping one.) The economy will balance out; when it does, companies will be looking to expand and migrate—and they'll be looking for qualified, knowledgeable IT people to help them through the process.
 |
 |
 |
 |
Cindy Pisco
$38,000
MCSE, A+, Distributed Computer Systems Analyst, 6 years in IT
West Palm Beach, Florida |
Donald Top
$60,000
MCP
Network Admin.
3 years in IT
Denver, Colorado |
David Guibord
$62,7000
MCSE, MCP+I, CCNA
LAN Admin.
5 years in IT
Farmington Hills, Illinois |
Mark Duncan
$64,000
MCP
Network Engineer
14 years in IT
Hampton, Virginia |
Beyond Your Salary
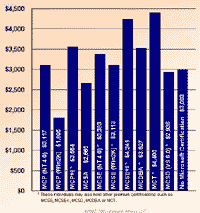
When it comes to other forms of compensation—profit sharing, retirement plans, stock options, and training and education allowances—Chart 2 shows what our respondents expect to receive this year.
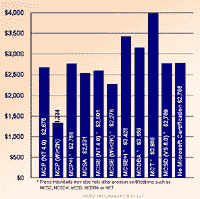
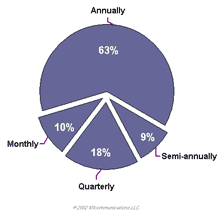
If you're curious about what portion of the totals in Chart 2 consists of monetary bonuses, see charts 3a, 3b and 3c for a breakdown of those amounts and how they're paid. About 53 percent of respondents—down from two-thirds in 2001—expect to receive a monetary bonus this year. (Numbers exclude the self-employed.)
| Total Non-direct Compensation by Certification |
 |
| Click the chart for a larger view. |
| Chart 2. We asked respondents to estimate the amount in additional compensation (monetary bonuses, profit-sharing, retirement plans, stock options, and training and education allowances) they expect to receive in 2002. Keep in mind that the survey was completed in April 2002, so the amounts shown are estimates of the total they'll receive this year. |
| Expected Bonuses in 2002 |
 |
| Click the chart for a larger view. |
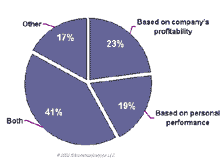
| Chart 3a. We asked the 53 percent of total respondents who said they receive monetary bonuses what they expect to receive in 2002, as well as how bonuses are calculated (see Chart 3b) and when they're paid (Chart 3c). |
| How Bonuses are Calculated |
 |
| Click the chart for a larger view. |
| Chart 3b. How bonuses are calculated. |
| How Bonuses Are Paid |
 |
| Click the chart for a larger view. |
| Chart 3c. How bonuses are paid |
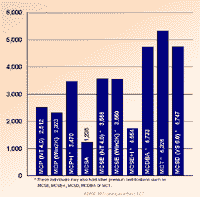
Back when dot-coms were exploding, stock options were considered an integral part of non-monetary compensation. Now, options are no longer as important as finding a company with staying power. Chart 4 shows the details by certification. Less than a quarter of our respondents said they receive stock options, and the average number received was 3,839 (down from 4,382 in 2001).
| Count of Stock Options Received |
 |
| Click the chart for a larger view. |
| Chart 4. We asked the 24 percent of respondents who said they receive stock options to provide a count. |
Another perk that seems to be dwindling in this volatile market is public recognition (monetary or otherwise) for certification. Last year, 39 percent of you said that your company has a formal program in place to recognize new certifications. It may take the form of a public e-mail message or an article on the intranet—or giving you the option of having new business cards printed to show off new logos. This year, only 33 percent of you responded that your company rewards technical certification.
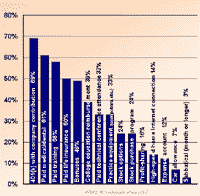
However, there are plenty of other job benefits out there. See Chart 5 for a listing of the more popular ones. At the top of the list, as reported by 69 percent of respondents: a 401(k) program with company contribution. At the bottom of the list with only 3 percent of respondents: paid sabbatical of a month or longer.
| Additional Compensation Offerings |
 |
| Click the chart for a larger view. |
| Chart 5. When we asked respondents what kinds of benefits their companies provide, once again 401(k)s with company contribution outranked some of the more traditional benefits, such as paid medical/dental. |
Experience Counts
As with most industries, a professional's skill; knowledge; and, therefore, worth increase over time. The technology business is no different. Chart 6 shows salaries by certification and experience. As you pay your dues in the field, you can expect to see a gradual rise in salary. (To see details for other Microsoft certifications, check the charts that run at the end of this article.)
| Salary by Experience |
|
MCP* |
MCSA |
MCSE* |
| 1 year |
$38,700 |
$37,400 |
$38,700 |
| 2 years |
$40,200 |
$45,300 |
$45,400 |
| 3 years |
$43,150 |
$46,400 |
$48,000 |
| 4 years |
$46,450 |
$53,000 |
$53,050 |
| 5 to 9 years |
$53,200 |
$61,000 |
$59,900 |
| 10 to 14 years |
$56,800 |
$74,700 |
$69,200 |
| 15 or more years |
$73,300 |
$74,800 |
$75,650 |
| * Includes NT 4.0 and Win2K | |
| Chart 6. These numbers represent only the average 2002 base salary. As would be expected, compensation increases with experience. The question we asked was, “How many years have you held a job that specifically involves computer networking/programming?” This question doesn't reflect direct experience with Microsoft products. Also, it doesn't include responses for self-employed professionals. For information on salaries by experience for other titles, see the detail charts at the end of the article. |
We asked respondents how many years they've held a job that specifically involved computer networking or programming. As expected, the level of all MCPs has risen this year to an average of 7.1 years (up from 2001's 6.7 years). MCSEs have continued to put more years under their collective belt as well, up from last year's 6.5 years to 6.8 years in 2002. It seems that the burgeoning population of newcomers in the last few years have opted to continue with the MCP program and have increased their knowledgebase and expertise. In previous surveys, the number for average years of experience has shrunk. This probably means fewer newcomers are expanding the ranks of IT and, thereby, diluting the count.
We're interested to see what happens next year, when .NET Server (and its accompanying certification track) is released. Are the NT 4.0 holdouts waiting for .NET or will they stay content with the certifications they hold?
 |
 |
 |
 |
David Whitson
$75,000
MCSE, MCP+I,
Sr. Web Developer/ Project Manager
20 years in IT
Fort Smith, Arkansas |
Edward Bailey
$56,380
MCSE
Network Administrator
2 1/2 years in IT
Livonia, Michigan |
Colin Bodkin
$44,500
MCSA, Network+, A+
Product Support Engineer
5 years in IT
Tucson, Arizona |
Mark Duncan
$85,000
MCP
Sr. Software Developer
16 years in IT
Dallas, Texas |
Where's the Money?
Quite a few respondents (51 percent) think others in the industry are better compensated than they are. Out of the optimistic few (17 percent) who believe they bring in higher salaries, about two-thirds said that their certification played a role in their success.
But what about the hard numbers? Well, once again developers top the salary chart with an average of $72,600, although their average salaries have taken a hit this year as well. Last year, MCSDs earned an average of $78,600.
MCSDs have traditionally been some of the highest wage-earners in the technology field. This year, however, it appears that those in management have taken the brass ring, with an average salary of $89,000. Those who opt out of the management track and choose to serve as a programming project lead (a non-supervisory position) take home, on average, $84,200. The gap in salary is most likely because of the difference of responsibility between those who write the code and those who manage projects or entire divisions.
Also high in the ranks are MCTs, with an average income of $70,600. Although this is down from last year's $78,000, it's still higher than 2000's average of $65,100. The decrease may be attributed to a number of factors. First, CTECs have fallen upon difficult times, as professionals have either opted not to recertify or have chosen self-study as a means to passing their exams. Second, the count for years of experience for MCTs has remained stagnant, indicating that, perhaps, some veteran MCTs have thrown in the towel with Microsoft's changes to the MCT program and new, less experienced trainers have entered the mix.
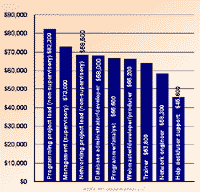
Another way to look at the numbers is by evaluating average salaries by job title alone, regardless of certification. Details are shown in Chart 7. These numbers are consistent with what we found in regard to MCSDs and MCTs. Generally, the highest salaries are earned by programming project leads ($82,300), followed by those in management ($73,000) and networking project leads ($68,500). The lowest salary, by title, is earned by those serving in the role of help desk/user support ($45,600).
| Salary by Job Title |
 |
| Click the chart for a larger view. |
| Chart 7. One of the many determining factors in salary is job title. We asked respondents to choose one of several titles that best described their position. Project lead is non-supervisory, but management is. Numbers are 2002 average base salary. |
 |
 |
 |
 |
Nelson DiMarco
$72,000
MCSE, MCP+I, CNA, A+
Network Admin.
5 years in IT
Alameda, California |
Jason Griffiths
$30,000
MCP
Assistant Network Administrator
2 years in IT
Charleston, West Virginia |
Gary D. Baker
$46,800
MCP
MIS Analyst II
8 years in IT
Miami, Florida |
Michael Hollen
$49,920
MCSE, A+, Network+
Instructor
5 years in IT
Visualia, California |
The Certification Factor
About a third of respondents (30 percent) believe that their certification helped them find or keep employment or led to a promotion in 2002, while another 40 percent listed certification as one of other factors. The final 30 percent believe that certification played no role in their job status.
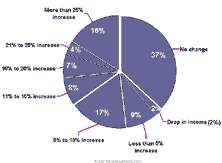
Chart 8 spells out what effect certification has had on salaries. A full third said it had no effect at all. Another third said they've received raises of more than 10 percent.
| Effect of Microsoft Certification on Salary |
|
|
| Click the chart for a larger view. |
| Chart 8. Although many respondents felt their Microsoft certification had no effect on their salaries, 16 percent reaped an increase of more than 25 percent. (More than a third of MCTs and nearly a quarter of MCSE+Is reported a more than 25 percent jump in their salaries due, in part, to their certification.) |
Sixty percent of respondents said they expect some sort of raise this year, with the average raise being nearly 15 percent (more than a third of MCTs and a quarter of MCSE+Is reported a more-than-25 percent increase in income due, in part, to their certification). Fifty-eight percent of total respondents said their income changes will be the same as or higher than expected.
Of those who expect a raise in 2002, nearly 20 percent said it was because they changed employers (that statistic is down from last year's 25 percent). Of course, that means 80 percent of you are staying at your current employers. Not a bad idea in today's market.
The Effect of Multiple Microsoft Certifications
Many readers have asked us about the effect of multiple Microsoft certifications on income. How many acronyms after your name actually make a difference? Although there's a diminishing return on investment after a certain number of titles, the numbers show that certain combinations of certifications can be quite lucrative.
This gets into the topic of the value of being a generalist vs. a specialist. Which approach is more valuable to your career? The fact is that Microsoft has defined narrow scopes for its credentials. What value could adding an MCSA to your developer title give you on the job? How does being an MCSE give you an edge as a database administrator? It's possible that, in a tight job market, those who are lightest on their feet (and more versatile in their skill set) can better weather the vagaries of corporate change.
So without providing any more of a rational explanation than that, we offer some results: If you have an MCSD and have recently attained your MCSA certification, you can expect an average salary of $77,500; that's slightly higher than the developer certification on its own. If you already possess an MCSE+I (worth an average of $68,600), you can jump to $72,800 by adding an MCDBA. If you have an MCSE, in addition to an MCSA title, your average salary increases from $46,100 to $57,400.
Other Certifications
The most popular certification for Microsoft Certified Professionals outside of the Microsoft realm remains CompTIA's A+, which stayed steady at 47 percent. The obvious reason for the certification's popularity lies in in the fact that it provides a vendor-neutral steppingstone between the MCP and MCSE certifications.
The second most popular certification this year, replacing Novell, is the Cisco CCDA, which is held by 35 percent of MCPs.
Chart 9 shows salaries by other certifications. At the top of the list is Compaq with its Master Accredited Systems Engineer (earning an average of $88,100), Accredited Platform Integrator and Accredited Systems Engineer titles. We won't venture a guess on what impact the Compaq-HP merger will have on salaries; by next year's survey, HP's 15,000-person layoff will have occurred and we'll see the numbers then.
| Salary by Other Certifications |
| Compaq Master Accredited Systems Engineer |
$88,100 |
| Compaq Accredited Platform Integrator |
$81,000 |
| Compaq Accredited Systems Engineer |
$79,500 |
| Master Certified Novell Engineer |
$78,000 |
| (ISC)2: Certified Information System Security Professional |
$77,800 |
| SANS Global Information Assurance Certification (GIAC) (any) |
$77,400 |
| Citrix Certified Enterprise Administrator |
$76,200 |
| Cisco Certified Design Professional |
$74,900 |
| Check Point Software Technologies (any) |
$74,700 |
| Red Hat Certified Engineer |
$74,600 |
| Oracle Database Administrator |
$74,400 |
| Certified Lotus Professional |
$74,100 |
| Sun Certified Programmer for Java |
$74,100 |
| Certified Lotus Specialist |
$73,800 |
| Sun Certified System Administrator for Solaris |
$73,300 |
| CompTIA Linux+ |
$72,300 |
| Cisco Certified Design Associate |
$72,100 |
| Certified Novell Engineer |
$71,700 |
| Cisco Certified Network Professional |
$69,400 |
| Prosoft Master CIW Web Site Manager |
$69,000 |
| 3Com (any) |
$68,500 |
| Citrix Certified Administrator |
$67,700 |
| Cisco Certified Network Associate |
$64,800 |
| IBM (any) |
$64,400 |
| Compaq Accredited Platform Specialist |
$63,400 |
| Certified Novell Administrator |
$63,100 |
| Prosoft CIW Associate |
$62,200 |
| CompTIA Network+ |
$60,600 |
| CompTIA Server+ |
$59,500 |
| Hewlett-Packard Company (any) |
$57,800 | |
| Chart 9. We asked respondents what certifications they held other than Microsoft's. Numbers are 2002 average base salaries. As with many skill comparisons, other variables (such as experience and multiple certifications) influence compensation other than the title itself, which may explain some of the large salary differences. |
Slow Upgrades
While in early 2001, the industry saw a flurry of NT 4.0 MCPs and MCSEs racing against the clock to recertify, Microsoft's reversal on its decision to retire the NT 4.0 track had a major effect on the number of professionals upgrading to Win2K. At this point, though, about half of the respondents are Win2K MCPs and only a third are Win2K MCSEs. We speculate that, following the announcement that NT 4.0 MCPs and MCSEs (along with MCP+Is and MCSE+Is) would retain their titles, the impetus to upgrade slowed dramatically.
When it comes to plans for the near future, nearly 90 percent said they plan to earn new or additional certifications in 2002. Forty-six percent of total respondents (including 73 percent of NT 4.0 MCSEs) intend to earn their Win2K MCSE, while 25 percent plan to attain Microsoft's newest certification, the MCSA. What's interesting is that while Microsoft intended the MCSA to be a mid-level certification (firmly planted between the MCP and MCSE), 29 percent of Win2K MCSEs said they plan on attaining this title.
Microsoft last overhauled its developer credential in 1999. Now, with the MCSD Visual Studio.NET and the MCAD, developers have found the next step on their certification path. Among MCSDs, 28 percent plan on attaining their MCAD, while a whopping 58 percent are intent on earning the Visual Studio.NET title.
The tables at the end of this article show what credentials certification holders expect to obtain next.
Who Gets the Bill?
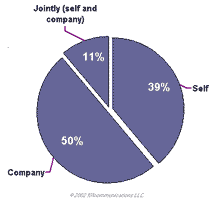
Surprisingly, it seems companies are maintaining their emphasis on continuing education—and they're paying for it. As shown in Chart 10, the percentage of companies paying for certification training increased slightly to 50 percent from last year's 46 percent (up from 39 percent in 2000) for those candidates who received it. The percentage of respondents that named training as a perk decreased slightly this year to 58 percent compared to last year's 61 percent (this is still higher than 2000's 35 percent). We speculate that, while times are tough, companies that have migrated (or are planning to migrate) want to make sure their people are as up to date on the latest technologies as possible. Also, this benefit is seen as an excellent retention tool for companies looking to keep their best and brightest on board—a management challenge in years when salaries must remain flat.
| Who Pays for Training |
 |
| Click the chart for a larger view. |
| Chart 10. This year the percentage of companies paying for certification training increased slightly to 50 percent from last year's 46 percent (up from 39 percent in 2000). The percentage of respondents who named training as a benefit of employment decreased slightly this year to 58 percent compared to last year's 61 percent, but is still higher than 2000's 35 percent. |
For the last few years, we've seen evidence that those respondents who work for companies where the costs of certification are paid also earn higher salaries. The average across the board for all certified professionals this year is $65,200, down from last year's $69,700. Those who took on the costs of certification themselves average $57,400, 10 percent lower than 2001's $60,000. Overall, though, those who pay for their own certification are closing the compensation gap.
If you believe that time is money, then you'd agree that the number of weeks allotted for training is a valuable commodity. Unfortunately, like money, training time has fallen this year. Respondents report they receive an average of 1.2 weeks of paid training per year, as compared to last year's 1.5 weeks. MCTs enjoy slightly more training time at 1.7 weeks per years, but that number is down significantly from last year's 2.3 weeks.
When it comes to how much respondents and their companies plan to spend, including materials and training, on certification in 2002, the average is $1,850. It took participants slightly less than two months to prepare for their latest exam and a little more than six months to complete their latest title.
In total, respondents spent 187 hours (just more than four and a half weeks of full-time work) preparing for certification in 2001 and expect to spend 199 hours in 2002. That count is a good bit lower than last year's 227 hours. The exception to this appears to be MCSEs on Windows 2000, who devoted an average of 351 hours preparing for their credential in 2001.
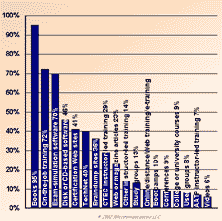
Chart 11 details the most popular tools for getting certification. Topping the list, as usual, are books, with 95 percent of you turning the pages to increase your knowledge. That's followed by good, old-fashioned, on-the-job training (72 percent) and exam-simulation software (70 percent). And, although the percentage is down slightly (40 percent in 2001), 36 percent of you still use braindump sites as a means for preparing for exams.
| Means of Certification Preparation |
| Books |
95% |
| On-the-job training |
72% |
| Exam-simulation software |
70% |
| Disk or CD-based software |
46% |
| Certification Web sites |
41% |
| TechNet |
40% |
| Braindump sites |
36% |
| CTEC instructor-led training |
29% |
| Web or magazine articles |
23% |
| Other instructor-led training |
14% |
| Study groups |
13% |
| Online/distance/Web training/e-training |
10% |
| Bootcamps |
10% |
| Conferences |
9% |
| College or university courses |
9% |
| User groups |
8% |
| AATP instructor-led training |
7% |
| Videos |
6% | |
| Chart 11. We asked respondents to list all the methods they've used in the last year to prepare for certification exams. |
 |
| Click the chart for a larger view. |
| Chart 11a. Graphic view of methods the repondants used in the last year to prepare for certification exams. |
Service with a Smile
Most of you work for one of two types of organizations: the kind that supplies services to external customers (solution providers, value-added retailers or systems integration firms) and the kind that serves internal customers (corporate IT/IS). We asked respondents which type they work for. Among those who aren't self-employed, we found that 38 percent work for a solution provider and 62 percent serve internal customers.
Why should it matter? Because solution providers pay better. Those respondents who work for solution providers earn $67,800; professionals providing internal IT services take home $59,600. In addition, those who work for solution providers enjoy larger average bonuses ($3,306) than the other group ($2,620). Of course, those with greater experience tend to work for companies that supply outside services rather than in corporate IT/IS, which helps explain the differences in salary and bonuses.
Regardless of the work environment, respondents said they have been with their current employers for, on average, about three and half years.
What about specific industries? Do some pay better than others? Overall, those individuals who work for Web/software development/ISV firms earn the most—an average of $69,600. Those who work for the government earn the least—an average of $56,500. Better-paid industries include systems and network integrators, R&D operations, finance/banking/accounting companies, aerospace and anything high tech, such as ISP/ASPs, data processing firms, telecommunications firms, and computer consultancies. On the lower end of the payscale you'll find these industries: retail, manufacturing, construction/ refineries/ petroleum, medical/dental/healthcare, marketing and entertainment, education and defense/military.
Various expertises also have a premium. Chart 12 shows salaries by skill level. According to our results, for example, if you have six months or more of experience in data warehousing, that will tend to make you more valuable than those who specialize in Linux. The same is true for expertise in Microsoft technologies. Experience with the newer products out of Redmond (such as Content Management Server and Mobile Information Server) tend to drive higher salaries. Chart 13 provides details.
| Salary by Skill |
| Data warehousing |
$73,200 |
| Outsourcing/ASPs |
$72,500 |
| Software design |
$72,000 |
| E-commerce |
$71,700 |
| Extranets |
$71,300 |
| Oracle |
$70,300 |
| Strategic planning |
$70,000 |
| Database development |
$69,300 |
| Web site development/management |
$67,200 |
| Hardware design |
$66,900 |
| Web services |
$66,800 |
| Database administration |
$66,500 |
| Unix |
$66,300 |
| Portable/embedded computing |
$65,900 |
| Wireless |
$65,200 |
| Intranets |
$64,800 |
| Telephony |
$63,900 |
| Linux |
$63,700 |
| VPN/Remote management |
$63,200 |
| Customer Relationship Management |
$62,800 |
| Novell |
$62,500 | |
| Chart 12. Survey results suggest that those with a specialization enjoy a higher salary. Keep in mind, that those with such skills also tend to have more experience, which plays a role in the higher average incomes. |
| Salary by Microsoft Expertise |
| Content Management Server |
$80,600 |
| Commerce Server |
$77,900 |
| Mobile Information Server |
$76,700 |
| Windows .NET Server |
$76,700 |
| SharePoint Portal Server |
$75,700 |
| Site Server |
$73,900 |
| Application Center 2000 |
$72,300 |
| Visual Basic or VBA |
$70,800 |
| Other development tools (ActiveX, Visual C++, C#, FoxPro, Access) |
$70,500 |
| SQL Server |
$68,000 |
| Systems Management Server |
$66,500 |
| ISA Server |
$66,000 |
| Internet Information Server |
$64,700 |
| Proxy Server |
$63,300 |
| Exchange Server |
$61,900 |
| Office, Project, Visio, FrontPage |
$61,300 |
| Windows desktops |
$59,100 | |
| Chart 13. When it comes to compensation by Microsoft expertise, specifically, newer technologies like Content Management Server, Commerce Server and Mobile Information Server, as well as Windows .NET, bring in the higher salaries. It's likely that professionals working with these new technologies also have more years of experience and are, therefore, better compensated. |
Other Income
Despite the economic downturn, it appears that IT professionals aren't looking for outside income as much as last year. In 2001, about 42 percent of respondents said they expected to receive additional compensation from job-related resources. Only 38 percent expect to receive outside income in 2002, with an average amount of $2,777, (down from 2001's $2,906). Perhaps this is because there are fewer opportunities to earn extra income. As would be expected, though, the amount of earned income increases in proportion to years of experience in the field. Those with three years or less of experience said they bring home less than $2,000 in extra income, as opposed to those with 15 or more years under their belts, who earn nearly $4,000, on average.
Working Hard, Playing Hard
Perhaps one of the reasons why outside income is lower is that you're putting in a little more time at the office. The average workweek has increased slightly, from 43 hours in 2001, to just more than 44 in 2002. The hours were fairly consistent across all job titles and certifications, although MCTs topped the numbers with an average of 46 hours per week.
It's important to remember, though, that as income rises, the number of hours worked per week also increases. About 38 percent of respondents said they work more than 46 hours per week; these same professionals make about 18 percent more than those who work fewer hours. If you want an income in the mid-$70,000s, then prepare to put in an average of more than 60 hours per week.
Since you're working hard, does that mean you're also playing hard? Fortunately, yes. The average amount of available vacation time held steady at 2.6 weeks, and 58 percent of you plan to take nearly all that time.
Job Satisfaction
So beyond the salaries, the bonuses, the perks, are you happy—really happy—at your job?
When we asked respondents how satisfied, overall, they were with their jobs, we found that 83 percent said they were either satisfied or very satisfied. When we got into the specifics, though, the picture darkened.
While 90 percent of respondents are satisfied/very satisfied with their coworkers and 73 percent are happy with their direct management, 41 percent said they're not satisfied with their company's overall management. In addition, 47 percent aren't happy with their compensation, and 66 percent feel their number of stock options is lacking.
Do Consultants Have it Better?
About 6 percent of the survey's respondents are self-employed. We asked them to provide us with some information to help us answer the question that goes through just about every worker's mind: “Would I be better off on my own?” Well, it depends. Yes, the $76,800 average income is attractive, but don't forget there are extra costs involved with going independent.
More than half (55 percent) of self-employed respondents contract directly with clients (which means they're responsible for filling out 1099s, filing their own income taxes and covering overhead costs) and earn an average of $76,700. Nearly 12 percent work through a broker/placement firm or IT staffing company and bring home about $69,300. The 33 percent of those who combine both methods, top the range at $79,200.
The certified professional who contracts directly with clients charges about $82 per hour. Per hour, the typical placement firm or broker charges $103 per hour, $62 of which the professional takes home.
Also, it appears that, like everyone else, those who are self-employed are working longer hours this year. The average workweek is up to 42 hours, as compared to 38 hours in 2001. Thirty-six percent responded that they work more than 46 hours per week. Previous research has told us that about two-thirds of those hours are billable.
Gender Differences
Once again, women in IT—9 percent of our respondents—are earning less than their male counterparts. This year, men are bringing in an average of $62,200, while women are earning an average of $58,900—a difference of $4,200. Although this sounds like bad news, it's actually encouraging. In 2000, there was a $10,000 difference between the genders. That gap narrowed in 2001, with the disparity dwindling to $7,100. (As a point of reference, the difference between the genders for those who aren't Microsoft certified is much greater—a whopping $13,300.)
The least disparity between the genders is within the NT 4.0 certification, in which women actually have a $500 advantage ($53,600 for women, and $53,100 for men). For the Win2K MCSE, the difference is $3,000 ($51,000 for women, $54,000 for men).
The certifications in which women are the poorest represented are MCSE+I at 7 percent, MCP+I at 8 percent and Win2K MCSE at 8.5 percent. On a more positive note, the percentage of female MCSDs rose this year to 12 percent (up from 11 percent in 2001) and is the highest representation of women across the board. Also, 10 percent of Win2K MCPs are women. That group represents the premium titleholders of tomorrow.
You can read more details about the gender gap in earning in the tables that follow this article.
The More You Know
This year's survey shows that, overall, education plays a role in compensation. Chart 14 provides a breakdown by academic level. The most common education level among our respondents is a four-year degree (33 percent), which garners an average income of $64,100. A master's degree brings the average income up to $69,200, and a doctorate tops the list at $70,300.
| Salary by Education Level |
| Doctoral degree |
$70,300 |
| Master's degree |
$69,200 |
| Post-graduate study without degree |
$67,800 |
| Four-year degree |
$64,100 |
| Two-year degree |
$57,100 |
| Attended some college |
$57,900 |
| Graduated from high school |
$53,100 |
| Some high school or less |
$56,400 | |
| Chart 14. Although it's not the most important factor in salary, we find a correlation between the level of formal education and compensation. Fifty-four percent of respondents hold at least a four-year degree. |
What About This Economy?
As much as we see this recession as a dent in salaries and would like it to simply go away, there are many out there for whom these tough times mean no income at all. Nine percent of our respondents have been laid off in the past year. While 64 percent of them have found another position and 8 percent have been rehired, there's still that 28 percent who have yet to find employment. The average length of unemployment was just more than three months.
Overall, respondents believe that the U.S. is slowly coming out of its economic downturn—59 percent, in fact. Twenty-five percent aren't as confident and don't see the market rebounding anytime soon. The remaining 16 percent just aren't sure. Among those who don't see the economy coming back to life soon, 79 percent said they believe that it would affect their careers and 80 percent believe it already has. On a brighter note, 46 percent of all respondents said that their Microsoft certification has had a positive impact on their job prospects.
Some more good news (especially for those seeking employment): 42 percent of our respondents are working at companies that plan to hire additional IT staff in the next 12 months, with the average number of open positions at 10. Of those whose companies will be looking to add IT workers, 68 percent responded that Microsoft certification would be a qualifying factor for job candidates.
Getting to Work
Although this year's numbers may seem discouraging, it's important to keep in mind that there are good jobs out there—as well as excellent salaries. The IT industry, just like the rest of the professional arenas, has fallen on some rough times; but it's important to remember that nothing lasts forever. The market will come back eventually—perhaps not to the highs of the '90s, but it will come back. And you need to be ready when it does. Experience remains the greatest factor in income levels. Make sure you're getting as much knowledge and hands-on experience as you can so that—when times do get better—you'll be adequately prepared to take advantage of the recovery.
It's also important to remember that location is a vital component in the salary equation. If you live in or near a major metropolitan area, salaries will be higher than more rural areas. Keep in mind that the cost of living of those types of areas is also quite different. Charts 15 and 16 show salary by major metropolitan area and state. (If you don't see your city referenced, it's simply because we didn't get enough response to provide meaningful data.)
| Salary by Metropolitan Area |
|
MCP |
MCP+I |
MCSE |
MCSE+I |
MCT |
MCSD |
| Atlanta |
$53,700 |
$63,700 |
$63,300 |
$69,900 |
$77,700 |
$75,600 |
| Austin |
$51,500 |
$56,000 |
$56,800 |
$70,200 |
$74,500 |
$68,800 |
| Baltimore |
* |
$64,600 |
$68,000 |
$64,800 |
$84,100 |
* |
| Birmingham |
* |
$57,500 |
$54,700 |
$58,500 |
* |
* |
| Boise |
* |
* |
$44,500 |
* |
* |
* |
| Boston |
$65,200 |
$69,900 |
$71,800 |
$79,600 |
$69,900 |
$91,100 |
| Buffalo |
* |
$57,500 |
$44,400 |
* |
* |
* |
| Charlotte |
$63,500 |
$58,900 |
$58,300 |
$68,400 |
$64,200 |
* |
| Chicago |
$46,700 |
$65,400 |
$62,900 |
$71,700 |
$78,500 |
$77,700 |
| Cincinnati |
$49,600 |
$54,500 |
$60,000 |
$65,400 |
$69,800 |
* |
| Cleveland |
* |
$60,700 |
$57,300 |
$62,900 |
* |
* |
| Columbus |
$48,200 |
$57,000 |
$49,300 |
$69,200 |
$70,700 |
$66,900 |
| Dallas/Ft.Worth |
$55,400 |
$62,600 |
$61,600 |
$66,900 |
$84,500 |
$88,700 |
| Denver |
$57,800 |
$62,200 |
$62,000 |
$68,000 |
* |
* |
| Des Moines |
* |
$56,200 |
$61,400 |
* |
* |
* |
| Detroit |
$53,400 |
$61,000 |
$59,100 |
$67,300 |
$63,300 |
$73,500 |
| Honolulu |
* |
$51,200 |
$53,200 |
* |
* |
* |
| Houston |
$51,000 |
$63,900 |
$64,100 |
$68,800 |
$76,300 |
$74,700 |
| Indianapolis |
$43,700 |
$63,500 |
$61,600 |
* |
* |
$59,500 |
| Kansas City |
$57,000 |
$62,500 |
$54,300 |
* |
* |
* |
| Las Vegas |
* |
$62,500 |
$46,400 |
* |
* |
* |
| Los Angeles |
$49,600 |
$63,800 |
$61,600 |
$71,000 |
$67,600 |
$78,200 |
| Memphis |
* |
$61,000 |
$58,900 |
* |
* |
* |
| Miami |
$39,700 |
$52,000 |
$53,900 |
$67,200 |
$80,600 |
$63,800 |
| Milwaukee |
$53,900 |
$57,100 |
$52,500 |
* |
* |
$63,000 |
| Minneapolis |
$54,600 |
$61,000 |
$62,500 |
$64,400 |
* |
$69,200 |
| Nashville |
* |
$63,400 |
$62,200 |
$70,700 |
$59,500 |
$76,000 |
| New Orleans |
* |
* |
$55,700 |
* |
* |
* |
| New York |
$57,100 |
$64,500 |
$66,300 |
$73,000 |
$86,400 |
$85,500 |
| Oklahoma City |
* |
$53,200 |
$48,100 |
* |
* |
* |
| Omaha |
* |
$53,900 |
$57,200 |
* |
* |
* |
| Orlando |
$43,500 |
$54,300 |
$54,400 |
$64,800 |
* |
* |
| Philadelphia |
$57,100 |
$67,600 |
$63,100 |
$74,200 |
$71,300 |
$71,500 |
| Phoenix |
* |
$62,300 |
$60,300 |
$70,900 |
$80,500 |
$76,000 |
| Pittsburgh |
$42,500 |
$56,500 |
$57,600 |
$67,500 |
* |
* |
| Portland, OR |
$43,800 |
$59,700 |
$58,300 |
$64,000 |
* |
* |
| Sacramento |
* |
$59,600 |
$55,600 |
$71,800 |
* |
* |
| Salt Lake City |
* |
$49,400 |
$51,600 |
* |
* |
* |
| San Antonio |
* |
$55,800 |
$53,800 |
* |
* |
* |
| San Diego |
* |
$60,800 |
$54,400 |
$73,200 |
* |
* |
| San Francisco |
$48,300 |
$73,700 |
$73,500 |
$78,900 |
* |
|
| San Jose |
* |
$80,300 |
$82,200 |
$83,400 |
* |
|
| Seattle |
* |
$62,100 |
$64,500 |
$74,500 |
$77,500 |
$81,600 |
| St. Louis |
* |
$60,800 |
$54,400 |
$62,100 |
$55,200 |
$65,200 |
| Tucson |
* |
$45,800 |
$46,900 |
* |
* |
* |
| Washington, D.C. |
$60,400 |
$69,800 |
$65,500 |
$76,200 |
$76,000 |
$78,300 |
| Table 15. We asked respondents what metropolitan area they live in, then tabulated average base salary. We had insufficient data to provide counts for the MCSA and MCDBA certifications. |
| Salary by State |
|
MCP |
MCP+I |
MCSE |
MCSE+I |
MCT |
MCSD |
| Alabama |
* |
$56,000 |
$55,600 |
$61,500 |
* |
* |
| Alaska |
* |
* |
$51,100 |
* |
* |
* |
| Arizona |
* |
$58,000 |
$58,300 |
$67,900 |
$71,800 |
$75,700 |
| Arkansas |
* |
* |
$48,200 |
* |
* |
* |
| California |
$52,000 |
$65,900 |
$63,500 |
$73,300 |
$73,200 |
$82,600 |
| Colorado |
$64,000 |
$61,300 |
$60,300 |
$67,800 |
$75,000 |
* |
| Connecticut |
* |
$62,200 |
$69,600 |
* |
* |
* |
| Delaware |
* |
* |
$62,300 |
* |
* |
* |
| Florida |
$43,400 |
$55,000 |
$53,700 |
$67,400 |
$74,000 |
$62,700 |
| Georgia |
$52,900 |
$61,500 |
$62,000 |
$66,500 |
$73,600 |
$74,500 |
| Hawaii |
* |
* |
$57,000 |
* |
* |
* |
| Idaho |
* |
$48,000 |
$46,300 |
* |
* |
* |
| Illinois |
$50,700 |
$63,200 |
$61,500 |
$69,300 |
$67,100 |
$72,300 |
| Indiana |
$46,600 |
$55,300 |
$56,400 |
$62,500 |
$60,900 |
$53,900 |
| Iowa |
* |
$53,200 |
$52,900 |
* |
* |
* |
| Kansas |
* |
$55,000 |
$50,300 |
* |
* |
* |
| Kentucky |
* |
$56,300 |
$53,600 |
* |
$62,900 |
$68,800 |
| Louisiana |
* |
* |
$51,600 |
* |
* |
* |
| Maine |
* |
* |
$50,100 |
* |
* |
* |
| Maryland |
$63,000 |
$65,700 |
$65,400 |
$69,400 |
$78,100 |
$84,200 |
| Massachusetts |
$67,500 |
$68,100 |
$70,600 |
$73,000 |
$85,500 |
$71,300 |
| Michigan |
$52,800 |
$59,800 |
$58,100 |
$64,200 |
$64,800 |
$72,800 |
| Minnesota |
$59,200 |
$59,200 |
$60,900 |
$61,600 |
* |
$69,700 |
| Mississippi |
* |
* |
$56,000 |
* |
* |
* |
| Missouri |
$46,100 |
$62,300 |
$55,600 |
$60,600 |
$57,900 |
$63,100 |
| Montana |
* |
* |
* |
* |
* |
* |
| Nebraska |
* |
* |
$52,400 |
* |
* |
* |
| Nevada |
* |
* |
$47,600 |
* |
* |
* |
| New Hampshire |
* |
* |
$67,500 |
* |
* |
* |
| New Jersey |
$63,600 |
$64,700 |
$62,900 |
$72,700 |
$80,000 |
$83,500 |
| New Mexico |
* |
* |
$58,100 |
* |
* |
* |
| New York |
$52,500 |
$60,700 |
$60,100 |
$66,100 |
$74,700 |
$82,500 |
| North Carolina |
$57,100 |
$58,200 |
$56,100 |
$63,400 |
$64,100 |
$81,200 |
| North Dakota |
* |
* |
* |
* |
* |
* |
| Ohio |
$49,300 |
$57,800 |
$56,300 |
$65,300 |
$66,900 |
$70,000 |
| Oklahoma |
* |
$50,200 |
$47,900 |
* |
* |
* |
| Oregon |
* |
$58,100 |
$58,200 |
$60,800 |
* |
* |
| Pennsylvania |
$45,000 |
$61,700 |
$57,200 |
$67,900 |
$69,400 |
$65,400 |
| Rhode Island |
* |
* |
* |
* |
* |
* |
| South Carolina |
* |
$54,300 |
$57,400 |
* |
* |
* |
| South Dakota |
* |
* |
$49,600 |
* |
* |
* |
| Tennessee |
* |
$62,500 |
$59,500 |
$71,700 |
$59,400 |
$74,900 |
| Texas |
$51,700 |
$60,400 |
$60,000 |
$67,200 |
$77,400 |
$77,900 |
| Utah |
* |
$49,600 |
$48,800 |
* |
* |
* |
| Vermont |
* |
* |
$56,500 |
* |
* |
* |
| Virginia |
$61,800 |
$67,100 |
$62,700 |
$76,400 |
$76,800 |
$74,200 |
| Washington |
* |
$59,000 |
$58,800 |
$71,700 |
$75,800 |
$80,800 |
| West Virginia |
* |
* |
$43,900 |
* |
* |
* |
| Wisconsin |
$54,200 |
$60,600 |
$54,700 |
$62,800 |
* |
$61,600 |
| Wyoming |
* |
* |
* |
* |
* |
* |
| Table 16. We asked respondents what state they live in, then tabulated average base salary. We had insufficient data to provide counts for the MCSA and MCDBA certifications. Data for Washington, D.C. is included in the table for salaries by metropolitan area. |
And let's not forget about job skills and, of course, certification. Those with premium certifications (MCSE, MCSD and so on), who are knowledgeable in the latest technologies and have taken on leadership roles will, naturally, be better compensated than those who hold the entry-level MCP and never move beyond the help desk.
So there are your next steps: Hold tight, continue getting the most hands-on experience possible, update your certification, pay your dues and take the leadership reins whenever possible. Your goals are within your grasp.
 |
 |
 |
 |
Chris Jeffares
$72,000+bonus
MCSE, CNA, A+, CAPS, CCA, CCEA
Business Technology Consultant
6 1/2 years in IT
Indianapolis, Indiana |
Jeff Budderly
$48,000
MCP, CNA, A+
Network Administrator
10 years in IT
Youngstown,
Ohio |
Brad Blauvelt
$39,500
MCSE, CCNA, A+
Network Technology Specialist
10 years in IT
Rapid City, South Dakota |
Michael Haisley
$37,000
MCP, CCNP,
CCNA
Web Developer
3 years in IT
Muncie,
Indiana |
About the Author
Kristen McCarthy is Senior Editor, Reviews of MCP Magazine.