PowerShell Pipeline
Working with Performance Counters in PowerShell
The PerfMon tool has a lot troubleshooting advantages going for it, but its interface isn't necessarily one of them. Here's an alternative.
Performance counters have been around forever in Windows.
Typically, when you are troubleshooting an issue on a server or workstation, one of the troubleshooting steps is to fire up PerfMon and start reviewing the performance of your system either with the default counters or by adding your own counters.
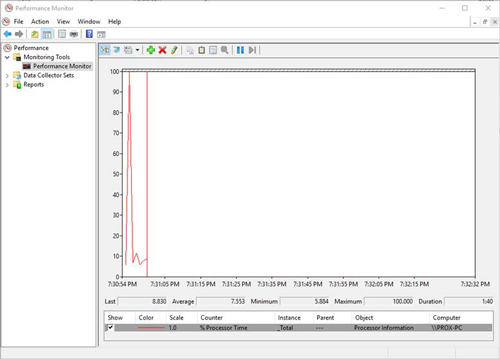 [Click on image for larger view.]
While this is great, and you can set it up to write to a file for review later on, it is GUI-based. Having worked in PowerShell for a while, we would love to have a way to pull this data without dealing with a sometimes-cumbersome interface.
In PowerShell, we have a single cmdlet, Get-Counter, which we can use to not only list out the available performance counters on a local or remote system, but also to monitor and display the data from the performance counters. By default, running the command will display a single instance of a set of counters over the period of one interval.
Get-Counter
 [Click on image for larger view.]
As you can see, the default counters that we are shown deal with the processor, memory and network, as well as some information about the hard drive.
Looking more at the command, we can see what parameters are available to use.
Get-Help Get-Counter
 [Click on image for larger view.]
If we wish to see more of the counters, we can make use of the –ListSet parameter and supply a wildcard value (*) which will then display all of the list sets that contain all of the counters.
Get-Counter -ListSet *
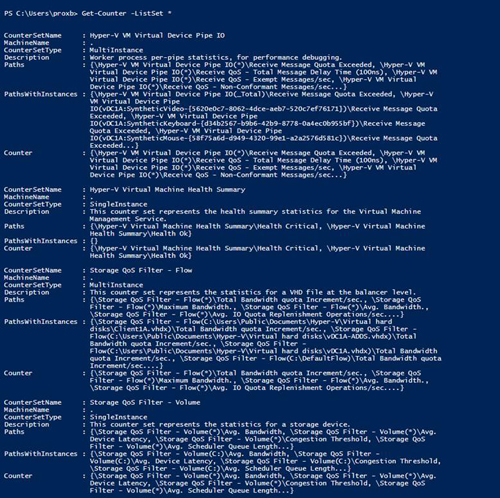 [Click on image for larger view.]
There is a lot of counter sets on each machine and this list only grows larger as you install more software, such as SQL, on your system. Because of this, it is advised that you attempt to narrow down your search to find the correct counters to use.
Let's look at some of the counters for processes and see what we have.
Get-Counter -ListSet process
 [Click on image for larger view.]
We can now dig deeper into this set and view all of the counters under the Counter property.
$ListSet = Get-Counter -ListSet process
$ListSet.Counter
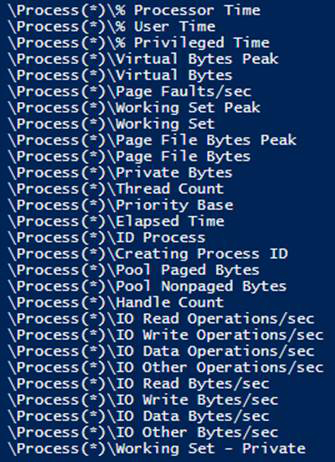
With this information, I can monitor a single process (or multiple processes) by taking the path and providing it to the Get-Counter command.
Get-Counter -Counter '\Process(*powershell_ise)\% Processor Time' -MaxSamples 5
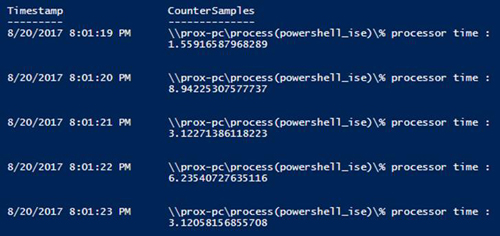 [Click on image for larger view.]
I decided to look at the process counter for PowerShell_Ise, which is the script editor for PowerShell, and wanted to monitor it over the course of five seconds. There is a switch for –Continuous, which means that this would run until I break the execution of the code.
We are not limited to a single counter, as made evident by the default counters that are used if we just run the command. We can add multiple paths in the Counter parameter that will be measured.
$Counters = @(
    '\\prox-pc\processor(_total)\% processor time',
    '\\prox-pc\memory\% committed bytes in use',
    '\\prox-pc\memory\cache faults/sec',
    '\\prox-pc\physicaldisk(_total)\% disk time',
    '\\prox-pc\physicaldisk(_total)\current disk queue length'
)
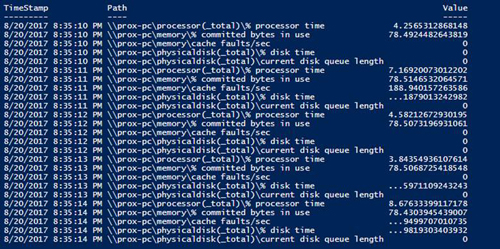
Get-Counter -Counter $Counters -MaxSamples 5 | ForEach {
    $_.CounterSamples | ForEach {
        [pscustomobject]@{
            TimeStamp = $_.TimeStamp
            Path = $_.Path
            Value = $_.CookedValue
        }
    }
}
 [Click on image for larger view.]
Note here that I decided to dig deeper into the object and pull out the cooked value. This will be useful when you are looking to dump this data to a .CSV file or ship it to a centralized area such as a SQL database. I only care about the time that the collection was taken, as well as what type of data and the actual data from the collection. The countersamples property provided everything if viewed from the console, but doesn't exactly translate well being an object going to a .CSV file. Flattening everything from the object to its own property will make life much easier in collecting performance counter data.
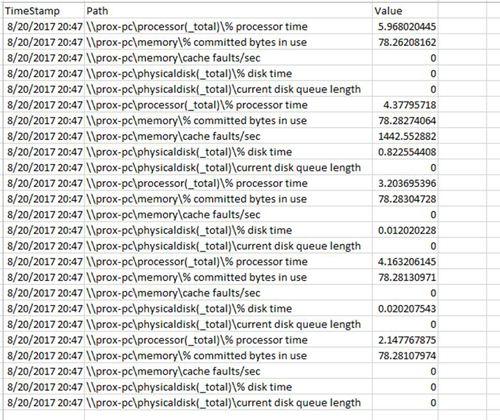
I mentioned dumping out the data to a .CSV file for later review or if you plan on running this for hours rather than a short amount of time. We can do that by simply writing out the output using Export-Csv to a file and then, when completed, we can open it up in Excel and see what we have to work with.
$Counters = @(
    '\\prox-pc\processor(_total)\% processor time',
    '\\prox-pc\memory\% committed bytes in use',
    '\\prox-pc\memory\cache faults/sec',
    '\\prox-pc\physicaldisk(_total)\% disk time',
    '\\prox-pc\physicaldisk(_total)\current disk queue length'
)
Get-Counter -Counter $Counters -MaxSamples 5 | ForEach {
    $_.CounterSamples | ForEach {
        [pscustomobject]@{
            TimeStamp = $_.TimeStamp
            Path = $_.Path
            Value = $_.CookedValue
        }
    }
} | Export-Csv -Path PerfMonCounters.csv -NoTypeInformation
 [Click on image for larger view.]
Depending on the type of data that you have collected, you could then begin working with it to graph out the data or work with it in a pivot chart. Either way, you have access to the data to work with yourself or provide to another party to review and analyze.
With that, we have covered the basics of performance counter-gathering using PowerShell. Hopefully, this will provide you with another alternative to using the PerfMon GUI and give you more flexibility in troubleshooting performance issues on your system.
About the Author
Boe Prox is a Microsoft MVP in Windows PowerShell and a Senior Windows System Administrator. He has worked in the IT field since 2003, and he supports a variety of different platforms. He is a contributing author in PowerShell Deep Dives with chapters about WSUS and TCP communication. He is a moderator on the Hey, Scripting Guy! forum, and he has been a judge for the Scripting Games. He has presented talks on the topics of WSUS and PowerShell as well as runspaces to PowerShell user groups. He is an Honorary Scripting Guy, and he has submitted a number of posts as a to Microsoft's Hey, Scripting Guy! He also has a number of open source projects available on Codeplex and GitHub. His personal blog is at http://learn-powershell.net.