PowerShell Pipeline
Creating a GUI Using Out-GridView in PowerShell
A beginner's guide to get Graphical User Interfaces up and running.
There are some amazing Graphical User Interfaces (GUIs) that exist out in in the community that do a wide variety of things. The problem with these that beginners run into are the complexity that is sometimes required when writing one. Whether it is using WinForms or Windows Presentation Foundation (WPF), there is a learning curve that is required of the person writing the code to put all of the pieces together. Fortunately, there is another way to get some limited UI functionality with nowhere near the difficulty of writing your own UI in the way of the Out-GridView cmdlet that comes with PowerShell.
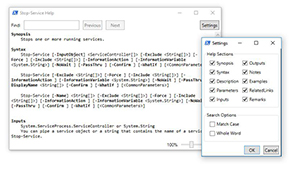
I'll start with a quick primer on using Out-GridView to handle some basic reports and then move to show a couple of cool things that maybe you haven't seen before in displaying information. To get started, we should look at the help file for this cmdlet to really understand what it can do and see information about the parameters.
Get-Help Out-GridView
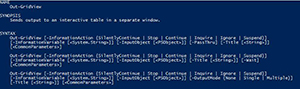 [Click on image for larger view.] Figure 1. Help file for Out-GridView.
We can see that there are a few parameters such as Title, which allows us to set the title on the GridView window that is display and also –Passthru which will actually take your selection in the window and return the object in the console. This is useful if you are looking to chain together multiple commands and want to have a UI selection window. In fact, that sounds like a great place to show this in action. We can take a look at processes which are running and then stop some process which we do not running.
Get-Service |

  Out-GridView -PassThru  -Title 'Services'  |

Stop-Service -WhatIf
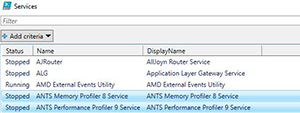 [Click on image for larger view.] Figure 2. Out-GridView example with Get-Service.
 [Click on image for larger view.] Figure 3. Action being taken upon selection in Out-GridView.
Filtering with Out-GridView can be done a couple of ways by either typing in the text box (there is a filter watermark in it) that will begin matching the input with all of the items in the GridView or you can use the Add Criteria menu to select a column to begin filtering on.
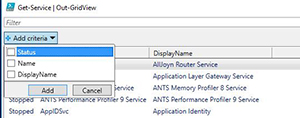 [Click on image for larger view.] Figure 4. Fiiltering in Out-GridView.
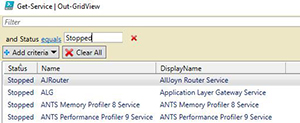 [Click on image for larger view.] Figure 5. More filtering in Out-GridView.
This gives us some ways to quickly filter for information and take action on it if needed. One last fun thing with this is if you wanted a quick way to go back in your history and run the same command again.
Get-History | Out-GridView -PassThru | Invoke-Expression
No more running just Get-History, finding the command you just ran and then trying to copy/paste it into the console to run it again!
Ok, so I lied about moving on from using Out-GridView to let you pick and run a command. The following one liner lets you quickly view the help for any cmdlet or function that is available
Looking at the cmdlet help:
Get-Command | Out-GridView -PassThru | Get-Help -ShowWindow
Looking at the About* Help Files:
Get-Help about* | Out-GridView -PassThru | Get-Help -ShowWindow
In both of these examples, you might have noticed the –ShowWindow parameter with Get-Help. This actually provides a great UI that displays the help information in a view that you can filter with.
 [Click on image for larger view.] Figure 6. Using the -ShowWindow in Get-Help.
Now onto some more fun stuff with taking what we can do with Out-GridView, like making a menu that you can present to determine the next course of action.
Writing a menu in PowerShell can be done but it can involve writing extra code to handle not only the presentation of the menu, but also handling the selection that is made by the user. We can setup an object which has, in this case, a number along with an action that will be taken upon its selection.
$Menu = [ordered]@{

  1 = 'Do something'

  2 = 'Do this instead'

  3 = 'Do whatever you  want'

  }


  $Result = $Menu | Out-GridView -PassThru  -Title 'Make a  selection'

  Switch ($Result)  {

  {$Result.Name -eq 1} {'Do something'}

  {$Result.Name -eq 2} {'Do this instead'}

  {$Result.Name -eq 3} {'Do whatever you  want'}

}
I use an ordered hashtable to ensure that the order of the data is being respected (a regular hashtable will not do this and just give an unpredictable order) as well as the hashtable will ensure that it is presented as a list that we can select from.
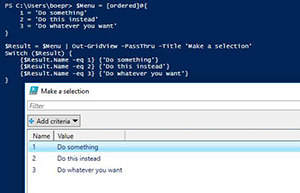 [Click on image for larger view.] Figure 7. Example menu using Out-GridView.
Upon making a selection, the result will be evaluated in the following switch statement and the appropriate action will be taken.
The last thing that I am going to show today is being able to present a graph in the GridView after making some adjustments to the data so it looks useful.
For my example, I will use drive space as the resource that we will be graphing as that is always something that we want to visually see in our results. The first thing to set up is our hash table, which has all of our parameter values that will be supplied to Get-WMIObject.
$WMI =  @{

  Filter =  "DriveType='3' AND (Not Name LIKE  '\\\\?\\%')"

  Class =  "Win32_Volume"

  ErrorAction =  "Stop"

  Property =  "Name","Label","Capacity","FreeSpace"

  Computername =  $Env:COMPUTERNAME

}
I still need to figure out what I will use as the character for my graph before I can go further with this. After some trial and error as well as some research online, I found that the CHAR for value 9612 provides a great visual for my graph.
Now that I have that taken care of, the next step is to collect my data containing the drive space and use it in my graph.
$List = New-Object System.Collections.ArrayList

  Get-WmiObject @WMI  | ForEach {

  $Decimal  = $_.freespace / $_.capacity

  $Graph  = "$($Bar)"*($Decimal*100)

  $Hash = [ordered]@{

  Computername =  $Env:COMPUTERNAME

  Name =  $_.Name

  FreeSpace =  "$Graph"

  Percent =  $Decimal

  FreeSpaceGB =  ([math]::Round(($_.Freespace/1GB),2))

  CapacityGB =  ([math]::Round(($_.Capacity/1GB),2))

  }

  [void]$List.Add((

  [pscustomobject]$Hash

  ))

  }

$List | Out-GridView -Title 'Drive Space'
I use an ArrayList to collect all of the data which includes the graph and then send it to Out-GridView as the last action. I am essentially looking to get the percentage of free space and then use that in my graph. This works nicely because I do not have to worry about scaling out the data to make it not only fit the window, but also will still be accurate in its representation.
The final result here is a nice little graph that can be viewed to quickly see the state of the drive space on the computer.
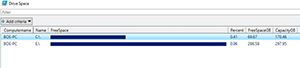 [Click on image for larger view.] Figure 8. Creating a graph within Out-GridView.
Now we have a quick and easy way to graph out the space on our systems without having to write a bunch of code to not only create the UI, but also create the graph to display the data. This wraps up my article on using Out-GridView to spin up a front end UI with only minimal code. I hope you enjoyed it!
About the Author
Boe Prox is a Microsoft MVP in Windows PowerShell and a Senior Windows System Administrator. He has worked in the IT field since 2003, and he supports a variety of different platforms. He is a contributing author in PowerShell Deep Dives with chapters about WSUS and TCP communication. He is a moderator on the Hey, Scripting Guy! forum, and he has been a judge for the Scripting Games. He has presented talks on the topics of WSUS and PowerShell as well as runspaces to PowerShell user groups. He is an Honorary Scripting Guy, and he has submitted a number of posts as a to Microsoft's Hey, Scripting Guy! He also has a number of open source projects available on Codeplex and GitHub. His personal blog is at http://learn-powershell.net.