PowerShell Pipeline
PowerShell Trend Reporting, Part 3: Excel and Word Reports
You have the data. Now turn it into a readable report.
More on This Topic:
So far in this series, we have looked at querying systems using WMI to pull the drive space and then spent some time looking at sending that data to a SQL server database where it can be saved for later use. We also looked at pulling data from the database so that it could be used in reporting. I am now going to show you how to do the reporting now using a combination of Excel and Word.
The goal here is to take the data that we have been writing to SQL and pull it down using a script and then send that to Excel so we can construct a graph that shows the total drive size and the current used space. This will give us our trend report showing the state of the drive space over a set period of time that can be used for whatever is deemed useful. But that is not all! We will assume that our manager is not concerned with the numbers behind the graph and aren't that particular about receiving spreadsheets and would rather have this in a Word document. With that in mind, we will take that graph and then move it to a Word document and saved.
Retrieving the Data from SQL
The first step in all of this is to gather the query the SQL database that we have been sending our drive space information to so it can then be processed in Excel. Using the same techniques shown in part 2, I can construct a T-SQL statement that will be sent to the SQL server via PowerShell and gather all of the information that we needs.
[string]$SqlServer  = $Env:COMPUTERNAME

  [string]$Database  = 'Drive_Space'

  [int]$ConnectionTimeout  = 30

  [int]$QueryTimeout  = 120

  $TSQL = "SELECT * FROM [tbDRIVESPACE] WHERE Computername = '$Env:COMPUTERNAME'"
#Connect to the SQL Server

  $SqlConnection=new-object System.Data.SqlClient.SQLConnection

  $ConnectionString = "Server={0};Database={1};Integrated  Security=True;Connect Timeout={2}" -f  $SqlServer,$Database,$ConnectionTimeout

  $SqlConnection.ConnectionString=$ConnectionString

  $SqlConnection.Open()

  $cmd=new-object system.Data.SqlClient.SqlCommand($Tsql,$conn)

$cmd.CommandTimeout=$QueryTimeout
#Issue command to sQL Server

  $ds=New-Object system.Data.DataSet

  $da=New-Object system.Data.SqlClient.SqlDataAdapter($cmd)

  [void]$da.fill($ds)
#Return back the results

  $Results = $ds.Tables[0].Rows
$SqlConnection.Close()
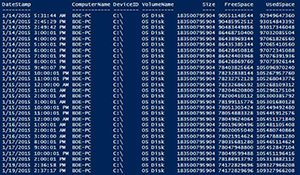
We can verify that we have at least some data to work with by looping at $Results.
$Results | Sort DateStamp | Format-Table -AutoSize
 [Click on image for larger view.] Figure 1.
It's not a lot of data at this point in time and only from a single system, but you can see how as time progresses as we continue to gather data from all of our available systems.We can use this to produce useful reports. And on that note, we will take this data and apply it to generate a graph using Excel.
As I am using Excel to produce the graph, I am first going to send this data to a CSV file so I can open it up in Excel. I also want to adjust some of the data, mainly the sizes so they are shown as GB instead of just being in bytes. This will ensure that the data and be better read without trying to make the adjustment to GB.
$Results | ForEach {

  $_ | Add-Member -MemberType NoteProperty  -Name CapacityGB  -Value ([math]::Round(($_.Size /1GB),2)) -PassThru |
    Add-Member -MemberType NoteProperty  -Name UsedSpaceGB  -Value ([math]::Round((($_.Size /1GB) - ($_.FreeSpace /1GB)),2)) -PassThru |
     Select DateStamp, CapacityGB, UsedSpaceGB
}  | Sort DateStamp |  Export-Csv -NoTypeInformation  "$($Env:COMPUTERNAME).csv
Now I will begin using Excel to open up the file and load the CSV file.
$File = "$($env:COMPUTERNAME).csv"
#Create excel COM object

  $excel = New-Object -ComObject  excel.application


  #Make Visible

  $excel.Visible  = $True

  $excel.DisplayAlerts  = $False


  #Various Enumerations

  $xlDirection=[Microsoft.Office.Interop.Excel.XLDirection]

  $excelChart = [Microsoft.Office.Interop.Excel.XLChartType]

  $excelAxes = [Microsoft.Office.Interop.Excel.XlAxisType]

  $excelCategoryScale = [Microsoft.Office.Interop.Excel.XlCategoryType]

$excelTickMark = [Microsoft.Office.Interop.Excel.XlTickMark]
Write-Verbose "Attempt  to resolve $($File)" -Verbose

  $File = (Convert-Path $File)
#Add CSV File into Excel Workbook

  $null = $excel.Workbooks.Open($File)

  $worksheet = $excel.ActiveSheet

  $Null = $worksheet.UsedRange.EntireColumn.AutoFit()
#Assumes that date is always on A column

  $range = $worksheet.Range("A2")

  $selection = $worksheet.Range($range,$range.end($xlDirection::xlDown))

  $Start =  @($selection)[0].Text

  $End =  @($selection)[-1].Text
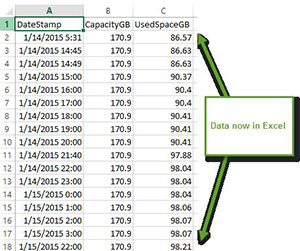
I can tell that my data has been added into Excel by looking at the open Excel workbook. I can see this because I enabled Excel to be visible. ($Excel.Visible=$True). Also note that I am saving some of the enums as variables which will make it simpler to access when I need the data.
 [Click on image for larger view.] Figure 2.
Now that I have my data, it is time to make some use of it by creating a graph.
$chart = $worksheet.Shapes.AddChart().Chart
 [Click on image for larger view.] Figure 3.
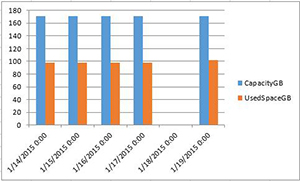
So this isn't really useful at all nor is it very nice to look at. But this is the first step in creating a useful graph. The next step is to set the graph to a different style.
$chart.chartType  = $excelChart::XlLine

  $chart.HasLegend  = $true

  $chart.HasTitle  = $true

  $chart.ChartTitle.Text = "$Env:Computername Drive Trend`n $((Get-Date $Start).ToShortDateString())  - $((Get-Date  $End).ToShortDateString())"
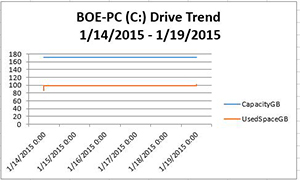
I have opted to make it a line graph and am including some extras such as a legend as well as giving it a title so we know exactly what we are looking at.
 [Click on image for larger view.] Figure 4.
As you can see, it is slowly coming together now. I can do some other things such as adjusting the height and width of the graph as well.
$worksheet.shapes.item('Chart 1').Name = $Env:COMPUTERNAME

  $worksheet.shapes.item($Env:COMPUTERNAME).Width = 500

$worksheet.shapes.item($Env:COMPUTERNAME).Height = 240
The last couple of things that need to happen involve setting up the X and Y axis labels and adjusting the tick types and also updating the font sizes.
#Work with the Y axis for the Date Stamp

  $xaxis = $chart.Axes($excelAxes::XlCategory)

  $xaxis.HasTitle  = $False

  $xaxis.CategoryType  = $excelCategoryScale::xlCategoryScale

  $xaxis.MajorTickMark  = $excelTickMark::xlTickMarkCross

  $xaxis.AxisBetweenCategories  = $False

$xaxis.TickLabels.NumberFormat =  "m/d/yyyy"
#Work with the X axis for the Size

  $yaxis = $chart.Axes($excelAxes::XlValue)

  $yaxis.HasTitle  = $true

  $yaxis.AxisTitle.Text = "Size (GB)"

$yaxis.AxisTitle.Font.Size = 16
The end result gives us a graph that looks something like the following image.
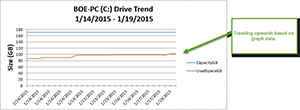 [Click on image for larger view.] Figure 5.
Here we can see that the drive space on C: appears to be trending upwards over the course of a few days. Definitely something that might want to watch closely to ensure that it doesn't max out the hard drive space. Of course, it could eventually drop back down.
This is nice, but with this graph also comes the Excel workbook and all of its data. Maybe someone cares to view that, but other times they may not and just want to see the picture showing where the drive space is heading. To achieve that kind of requirement of just showing a chart, we will make use of Word to handle that.
The first thing to do is get Word up and going.
#Create Word object and add new document

  $word = New-Object -ComObject  word.application

  $doc = $word.Documents.Add()
With the new document added, we need to copy the chart from Excel and then paste it into Word.
#region Copy Chart

  $worksheet.ChartObjects().Item(1).copy()

  $word.Selection.PasteAndFormat(16)  #Adds chart as an OLE object to Word

#endregion Copy Chart
Now we just need to save the Word document and perform a little cleanup and we are all done!
#region Save Close everything up

  $Report = "C:\Users\proxb\$($Env:COMPUTERNAME)TrendReport"

  $doc.SaveAs([ref]$Report,[ref]$SaveFormat::wdFormatDocument)

  $excel.Workbooks.Close()

  $word.Quit()

  $excel.Quit()

#endregion Save Close everything up
And since we are using a COM object, we just need to clean up after that as well.
#region Cleanup

  $null = [System.Runtime.InteropServices.Marshal]::ReleaseComObject([System.__ComObject]$excel)

  $null = [System.Runtime.InteropServices.Marshal]::ReleaseComObject([System.__ComObject]$word)

  [gc]::Collect()

  [gc]::WaitForPendingFinalizers()

  Remove-Variable excel,word -ErrorAction  SilentlyContinue

#endregion Cleanup
With that, we now have a report that can be sent to a manager to show the current state of drive space on a system. Using PowerShell, we can easily generate reports showing the current trend of drive space on our systems!